I'll admit I'm in a curmudgeonly mood because I feel like I'm wasting time writing about something so obvious. But we've been implicated in a strange argument that erupted in the blogosphere last week, so I'm compelled to write a few words to clear our name. As we mentioned in our last post, a few days ago Steven Pinker reviewed Malcolm Gladwell's latest book and criticized him rather harshly for several shortcomings. Gladwell appears to have made things worse for himself in a letter to the editor of the NYT by defending a manifestly weak claim from one of his essays – the claim that NFL quarterback performance is unrelated to the order they were drafted out of college. The reason we're implicated is that Pinker identified an earlier blog post of ours as one of three sources he used to challenge Gladwell (yay us!). But Gladwell either misrepresented or misunderstood our post in his response and admonishes Pinker by saying "we should agree that our differences owe less to what can be found in the scientific literature than they do to what can be found on Google."
Well, here's what you can find on Google. Follow this link to request the data for NFL quarterbacks drafted between 1980 and 2006. Paste the data into a spreadsheet and make a simple graph of touchdowns thrown (as of 2008) versus order of selection in the draft to create the picture below.
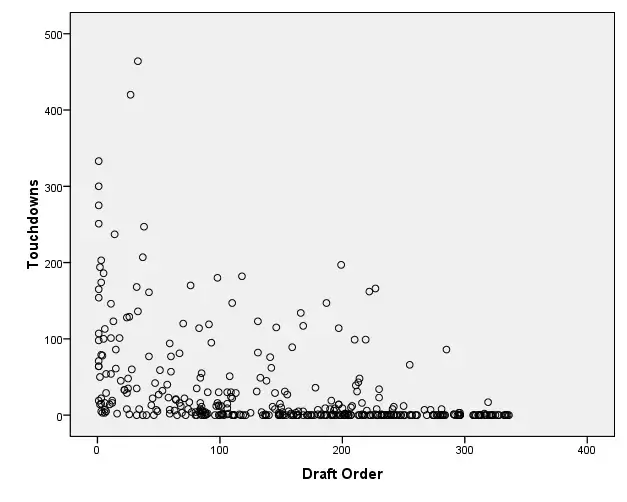
The graph includes 373 QBs with a correlation of -.40. If you take the log of TDs the correlation increases to -.57. But correlation can be misleading here because the data are heavily skewed and stacked at zero. Instead, just focus on the perfectly transparent visual display. What is the probability that a quarterback throws 50 or more touchdowns if picked early in the draft? Is the probability lower for QBs picked later in the draft? If you were going to predict performance, would you want to know the draft position of the QB before you made your prediction? The answer to this last question is an unequivocal yes.
So how do you make this plain-as-day association disappear? You can eliminate some of the data by declaring it off-limits. For example, an economist named David Berri has recently published an article claiming that the correct way to look at the above data is by filtering some observations and making some transformations. (I am working from his blog post here as the journal article is not yet available at my library.) On his blog, Berri says he restricts the analysis to QBs who have played more than 500 downs, or for 5 years. He also looks at per-play statistics, like touchdowns per game, to counter what he considers an opportunity bias. Because early draft picks are given more opportunity to play, there is a natural correlation between draft order and playing time which might inflate the career statistics like total touchdowns.
Fair enough, but you have to be careful about writing off one source of covariance as a bias in need of correction. Longevity in the NFL is a function of opportunity and success. To attribute all the covariance between playing time and draft order as some sort of opportunity bias is to dramatically redefine the logic of the question. Does anyone believe that NFL owners and coaches are just "socially promoting" their early draft picks to run up these gaudy production stats, while equally able QBs with the misfortune of being selected later in the draft sit idly by and watch? Yes, there are Tom Bradys sitting on the bench... but very very few quarterbacks picked 199th in the draft are remotely as good as Brady proved to be, whereas several QBs picked in the early rounds are as good. You can't look at the above graph and not agree that there is some association between draft order and the probability of being a high producer. It doesn't make sense to say that graph is an illusion due to uncorrected factors.
Even when I do take a few chops at the above data, I can't eliminate the strong correlation. The correlation is still there when I do TDs per game. It's there when I restrict the data for at least 100 pass attempts. The correlation is even bigger when I do TD per game for QBs picked in the first 100 positions of the draft. I can't get the association to go away, and I'm going to let these graphs stand as a challenge to Gladwell's statement that no prediction is possible regarding the future success of NFL quarterbacks. The consensus of the predictive information reflected in draft order out of college unambiguously does predict future performance.
This Thanksgiving kids everywhere will choose sides for pick-up games of football. Oh, how silly are these kids who make alternating choices to fill up two teams! Just let Sally pick the first 10 players and let Johnny pick the next 10 and let the games begin. After all, where no prediction is possible, everything else is just prejudice, right?