
Last Thursday morning there was a bump in the futures markets as the latest weekly numbers for initial unemployment insurance claims were released. The numbers were apparently better than expected, and the futures markets reacted positively. Jobs data are, now more than ever, an important economic indicator driving investor sentiment.
In previous blogs, we've discussed whether the utilization rates of our software tools for employers to test prospective employees could serve as an advance indicator of the national jobs picture. A usage metric we track called the Hiring Activity Index represents the percentage of our clients who are actively testing prospective employees in a given month. Earlier this year we focused on the upticks we saw in the HAI in February and March, which we thought were harbingers of better (or at least "less bad") jobs data to come.
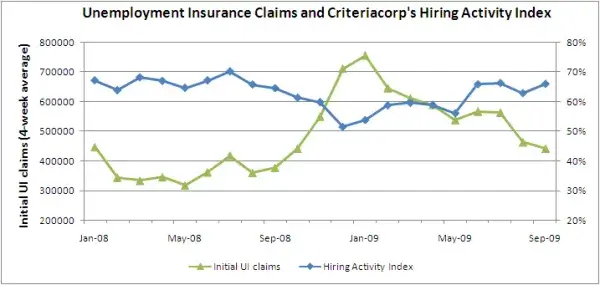
Turns out we were right about that, and we thought we would share what the trends look like with 21 months worth of data. We've plotted the initial unemployment claims data (weekly numbers, smoothed over a month) with the monthly Criteria Corp Hiring Activity Index. The trends look similar, and indeed they correlate very well. The correlation is -.79, showing excellent correspondence between the rise and fall of the jobs data and the HIA. Furthermore, when predicting the jobless claims on the basis of the concurrent HAI and the HAI from the two previous months – using a lagged regression model - the multiple R is .93 (Adjusted R2 = .85).
The point is that real time utilization data for an employee assessment service with a modest client base of small and medium sized businesses can provide very good predictions of national trends. We see this as similar to reports earlier this year that Google searches for flu related topics mapped on closely to CDC data for the spread of influenza. That was also an example where a real-time indirect indicator predicted definitive data that would be available later.
We mostly see this finding as validation of our earlier interpretation of the HAI. There are a number of caveats, including that the time series are short, and that we have used the non-seasonally adjusted UI numbers. Presumably, our client base operates on a similar seasonality as the initial claims data, and that inflates the correlation. Furthermore, the time series for the HAI also represents the growth and development of our company (our client base grows by a factor of 5 across the time span), so the data change meaning somewhat across time.
We don't expect to move the financial markets with these data. But we do take them as an indication that our services and our clients are moving with the times.