It may seem hard to imagine, but there was a time not so long ago when data was hard to come by. Not anymore. Today we’re experiencing a data explosion the likes of which have never been witnessed before. If that sounds dramatic, consider this incredible fact: According to the World Economic Forum, the number of bytes in the digital universe at the beginning of this year alone was 40 times bigger than the number of stars in the observable universe.
This astonishing expansion of data has impacted every aspect of our lives. Today, data empowers us to do amazing things like identify breast cancer and optimize routes for packages. But it also comes with challenges, namely greater complexity in decision making caused by overwhelming amounts of information that obscure meaningful insights and make it hard to take informed action.
Nowhere is this challenge more visible than in the HR industry. A study conducted last year by Deloitte Consulting determined that most organizations use between four and seven analytics tools to capture an increasing amount of ‘people analytics.’ Despite the growth in data and technology, however, the majority of these organizations struggle to produce accurate and timely insights. The challenges organizations face in extracting meaningful insights is the driving force behind one of Criteria’s most exciting and anticipated feature releases in 2020.
Introducing Criteria’s new Reporting and Analytics Features
As a company, Criteria has always focused on helping organizations make better talent decisions without complex, confusing technology. Our Reporting and Analytics features are no different.
Our mission for our reporting and analytics feature is simple: make meaningful data easily accessible and intelligible to every member of an organization so that hiring teams can make better, data-driven choices when it comes to sourcing, selection, and hiring. Check out this video walkthrough to see it in action:
To that end, we focused on integrating four key elements into our reporting and analytics feature to ensure that the solution as a whole lives up to our mission of making data accessible and intelligible.
Provide a Holistic View
One of the pitfalls of providing data in a vacuum is that it can lead to a purely tactical approach by prompting teams to focus on one data point by itself. To prevent hiring teams from getting lost in the proverbial weeds, we created a holistic view of hiring and recruitment metrics that colors outside the box of standard hiring metrics.

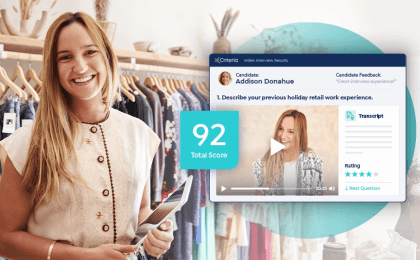
This view includes candidate insights and feedback, as well as tools like filters that allow teams to analyze and evaluate data versus just looking at a number in isolation.
While each component of the dashboard provides insight into a specific area of analysis, the real power comes from looking at it as a system of interlocking data. Taken together, the data provide a view of where your recruitment efforts stand in relation to candidate quality, candidate feedback, and operational efficiency.
Create Clarity, Not Confusion
Our goal from the start has been to help talent acquisition teams consume data instead of being confused by it. To that end, we emphasized data visualizations that prioritize ease of use and apprehension. Put simply, we made it easy to get insights in a glance – no data science degree required.
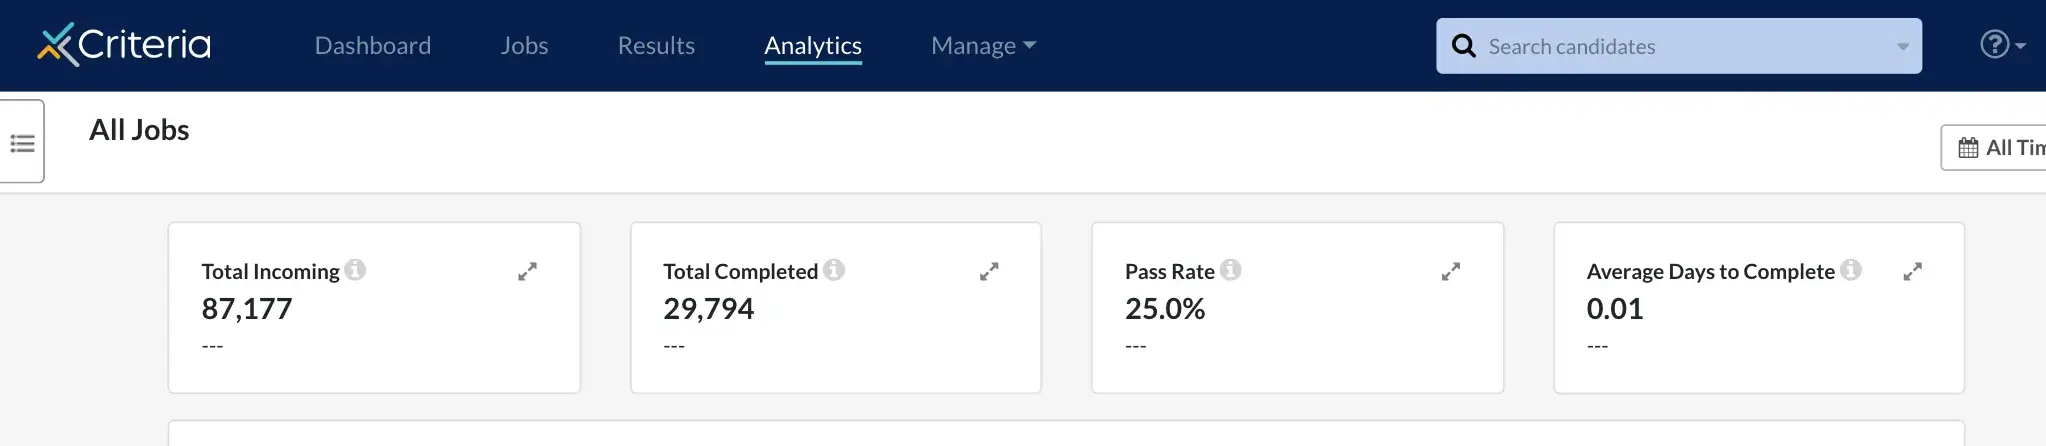
One great example is our data snapshots: four key metrics that put hiring performance at your fingertips by elevating critical hiring stats to a visible location.
Make Data-Driven Optimizations
Data and insights don’t mean much of they are not actionable. Our aim from the very beginning was to empower teams by helping them prioritize better hiring outcomes through meaningful, data-driven adjustments.
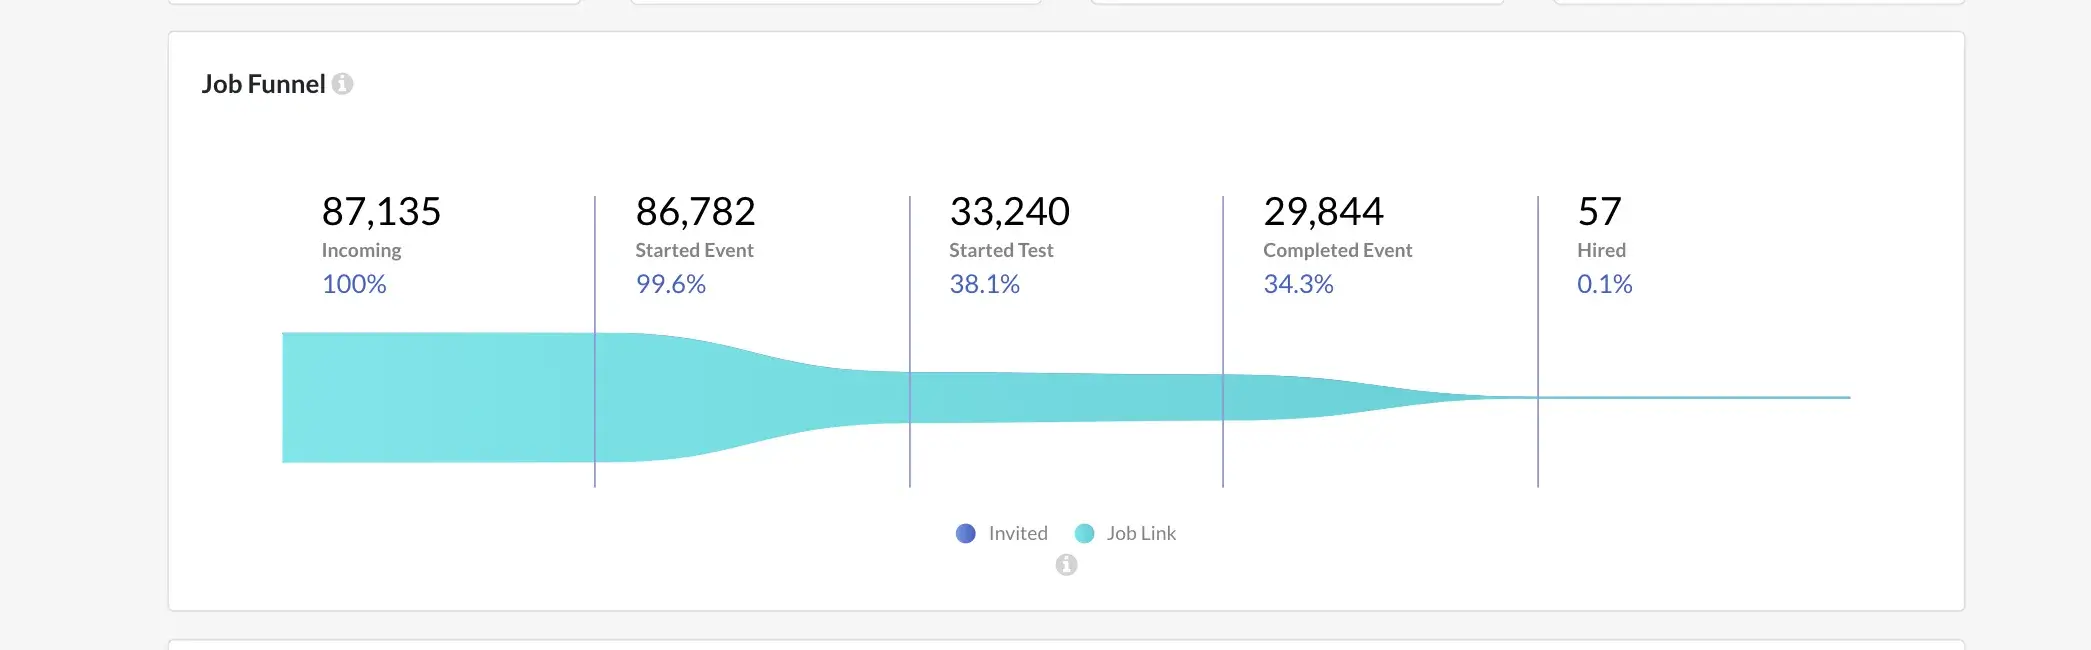
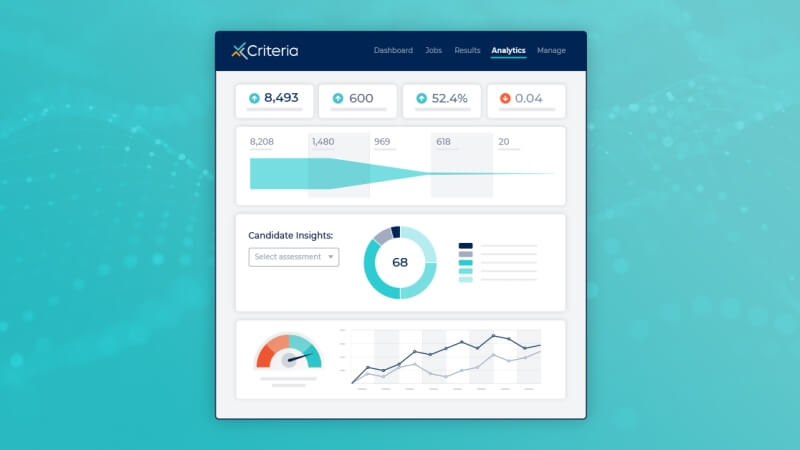
One great example is the Job Funnel data in the Reporting and Analytics feature. Hiring teams can track conversion rates, identify the source of quality candidates and even track test completion rates to help inform assessment strategy. A sharp drop-off between candidates who started a test and those who completed it could indicate a test that’s too hard, as an example, or it could warrant deeper analysis. Are the candidates who complete the test coming from a specific source?
In short, features like the Job Funnel data are a great example of how we help hiring teams maintain a clear line of sight into applicant volume and yield so they can make informed optimizations to their hiring processes.
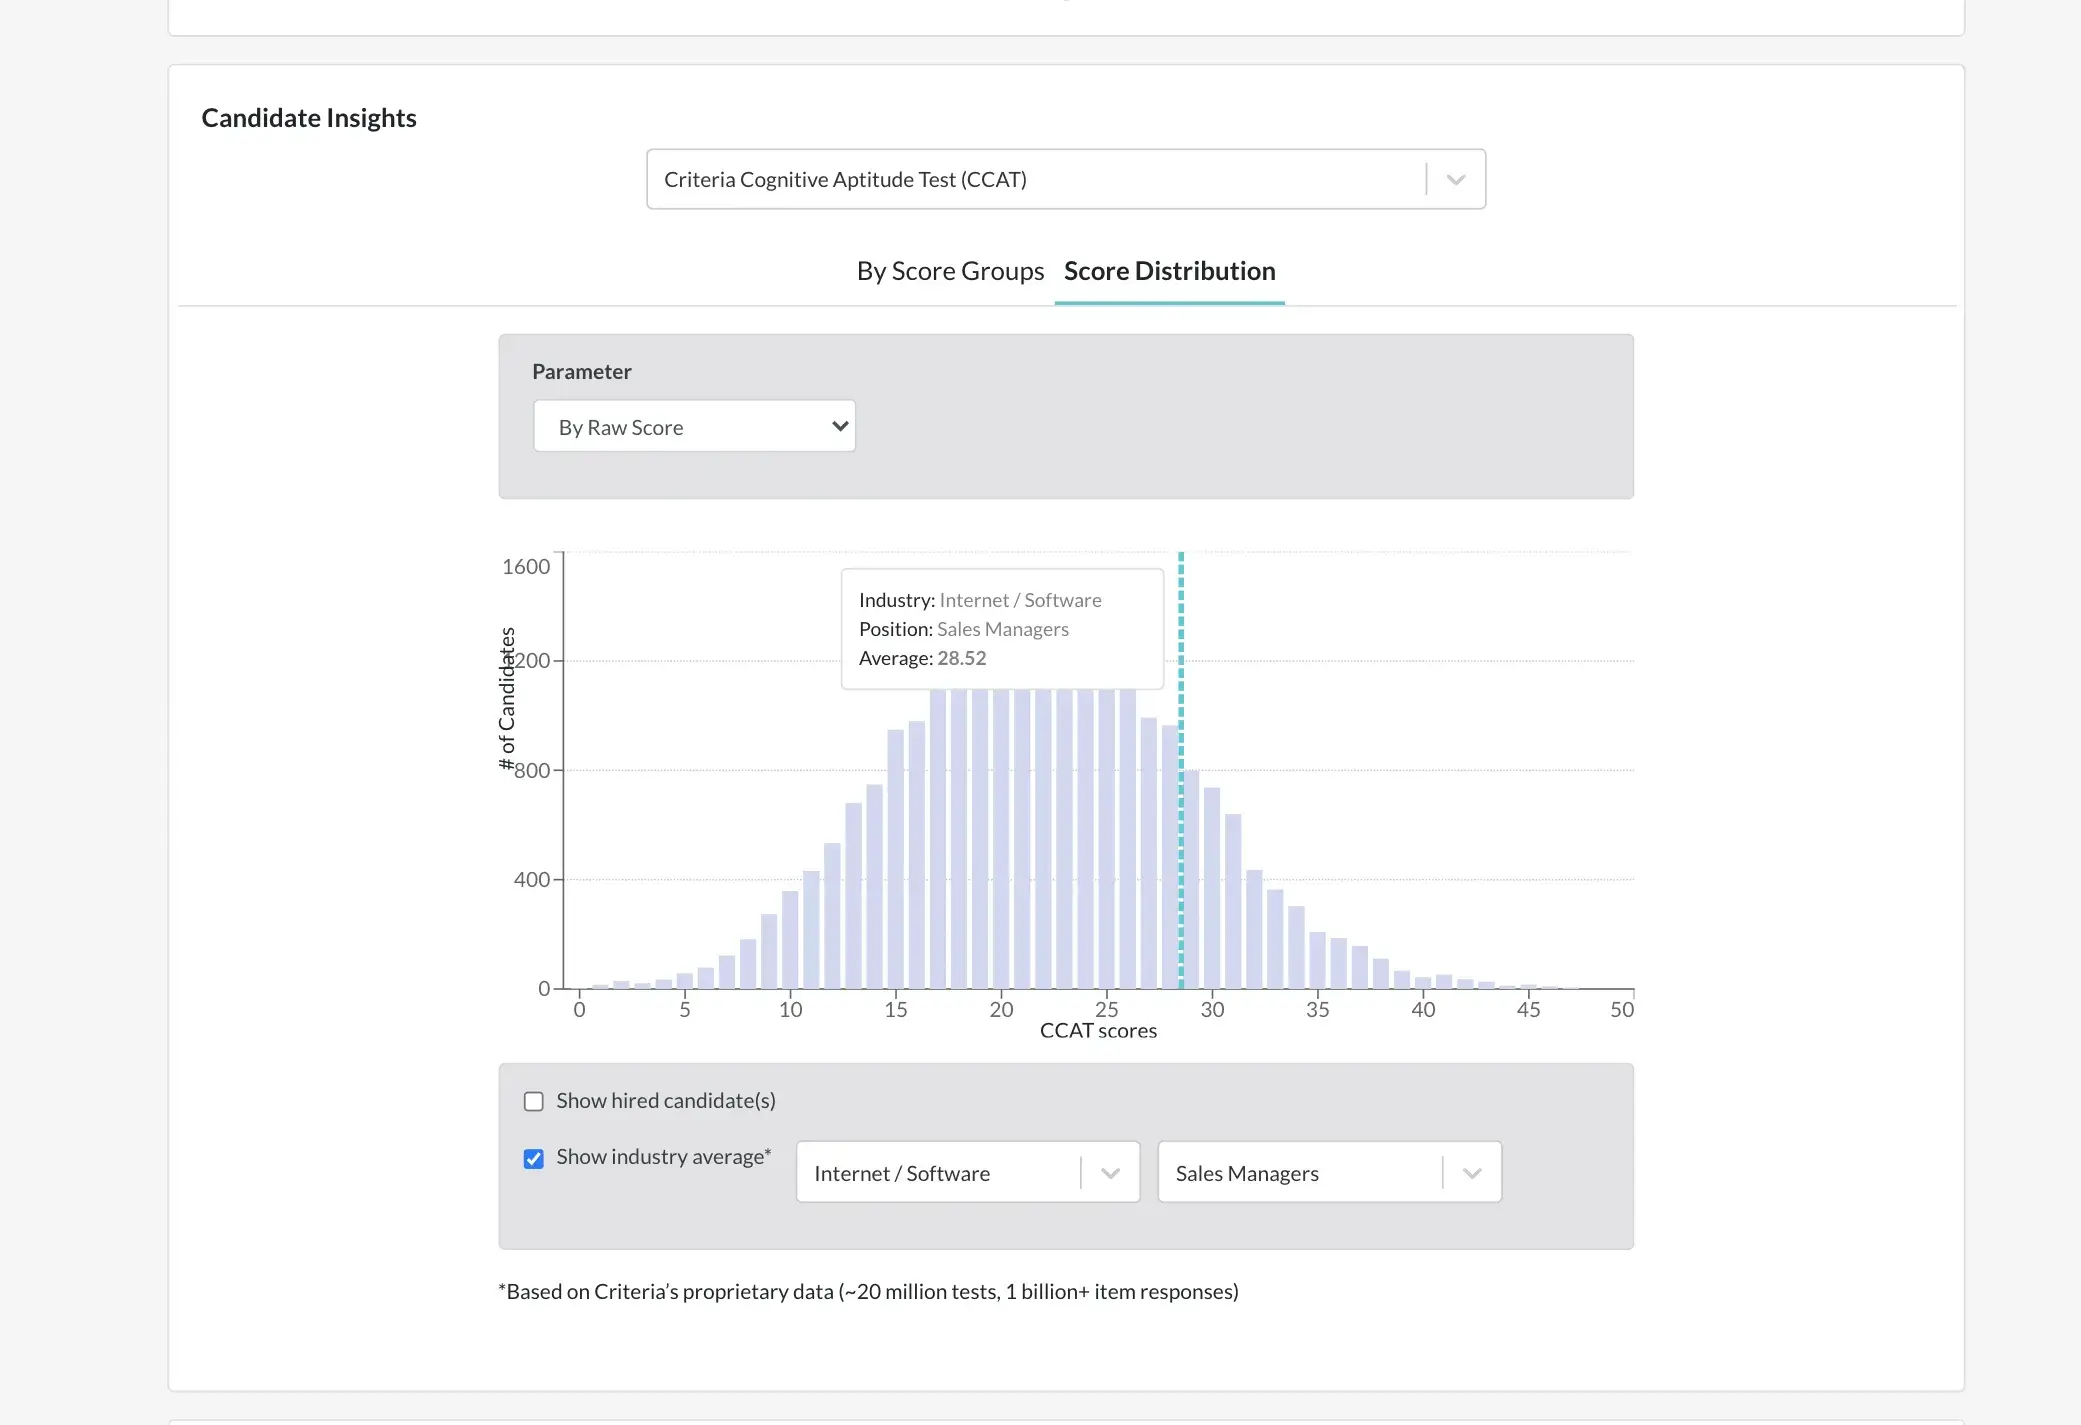
Context, Context, Context
Providing meaningful context is a huge element of the overall technical and aesthetic design of our reporting and analytics feature. Take for example the ability to understand the quality of your candidate pool. Anonymized data allows you to evaluate candidate quality by scores, tests, and to even compare candidates to industry averages by either the test taken, or their specific role.
Another exciting element of the feature is the ability to integrate candidate feedback scores into your overall hiring and recruitment picture. Other analytics tools focus on operational efficiency as they pertain to hiring processes, but our commitment to candidates as equal stakeholders in the hiring process made it essential to integrate candidate experience data into your hiring metrics. We could think of no better way to arm hiring teams with evidence to make the case for improving the candidate experience.
A New Foundation
We know our reporting and analytics feature will continue to garner excitement and engagement, but more importantly, we’re excited to provide our customers with a robust foundation for building a data-driven culture using a holistic, context-driven analytics feature that balances efficiency with empathy for candidates. We hope you enjoy using it as much as we enjoyed creating it!