
The Wall Street Journal last week ran an interesting article that summarizes a study that aggregates personality data on a state by state basis. The research is based on a Five Factor approach to studying personality (Agreeableness, Conscientiousness, Extraversion, Neuroticism/Stability, and Openness). Criteria's pre-employment testing solution features a personality inventory, the CPI, that is built on the same theoretical principles – and other employment personality tests that we offer also focus on a subset of these traits. Armed with over 600,000 internet surveys, the researchers showed that on average, respondents from North Dakota were the most agreeable in the country, and those in Alaska – by a huge margin – were the least agreeable. Alaska also ranked near the bottom on the other four personality dimensions too — but we'll have more on that in another blog post. But before we jump to any conclusions, let's stop to consider why small states seem to pop up a lot near the top and bottom of these lists.
A lot of it has to do with a simple principle of statistics that as sample size increases, variability due to measurement error tends to decrease. This is why it is safer to be in a mutual fund than in a single stock. Although the upside of the single stock is greater, so too is the downside, and risk management suggests you should invest more broadly to limit the variance.
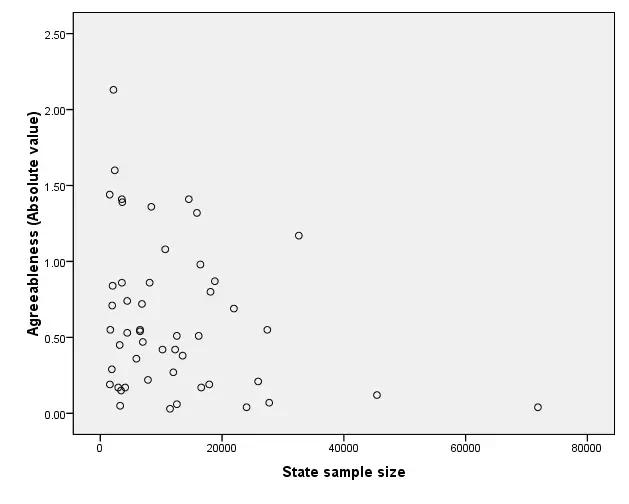
So how would this affect 600,000 surveys? Well, when those surveys are divided across 50 states, very unequal sample sizes occur across the board. Those agreeable folks from North Dakota submitted 2,372 surveys, while Californians submitted 71,873. If you were doing sophisticated polling for an election survey, either sample size should get you a good estimate of people's preferences. But when you're assessing something trickier to measure, like personality traits, and when the samples are either self-selected participants who stumble across the website, or students told to go to the website for course credit, there can be considerable variation due to measurement error. This will tend to diminish as the size of the sample increases.
A graph can save a thousand words. We've plotted the absolute value of the scores on the agreeableness scale against the population size. You can see the clear descending triangle. The chances that a state has an extreme score on agreeableness (either high or low) goes down as the sample size goes up.
We don't mean to deny that there are interesting patterns in the personality data reported in the study. On the contrary, we're quite intrigued and expect to make a few more blog posts on the topic. We're just reminding people that when the 50 states are ranked from highest to lowest on anything that has a lot of measurement error, states with smaller samples will be overrepresented in the top and bottom parts of the list.
None of this should take away from the achievement of North Dakota in being ranked most agreeable in the country. It's just that if there had been two million surveys instead of two thousand it would have been even more impressive. Of course two million surveys from North Dakota would have been an even more serious problem...