What is an Outlier?
Definition of Outlier:
In statistics, an outlier is a data point that differs greatly from other values in a data set. Outliers are important to keep in mind when looking at pools of data because they can sometimes affect how the data is perceived on the whole.
In pre-employment testing, the most common data that is observed are test scores, usually plotted against a measure of employee performance. Examining the data will help determine how correlated test scores are with test performance. In any given sample, however, there are likely to be outliers, and it’s important to avoid focusing on outliers as opposed to the trends presented by the data on the whole. Take the example below:
A company administers an aptitude test to their current sales staff to see how correlated their test scores are with job performance, quantified in this case by monthly sales. These were the results:
| Employee # | Test Score (out of 100) | Monthly Sales |
|---|---|---|
| 1 | 71 | $69,243 |
| 2 | 34 | $67,445 |
| 3 | 84 | $55,767 |
| 4 | 71 | $50,240 |
| 5 | 61 | $46,772 |
| 6 | 5 | $41,389 |
| 7 | 92 | $40,102 |
| 8 | 65 | $37,655 |
| 9 | 45 | $34,241 |
| 10 | 74 | $31,498 |
| 11 | 53 | $31,400 |
| 12 | 65 | $30,084 |
| 13 | 45 | $29,751 |
| 14 | 50 | $27,782 |
| 15 | 41 | $26,997 |
| 16 | 45 | $24,408 |
| 17 | 29 | $21,126 |
| 18 | 38 | $18,665 |
| 19 | 78 | $12,505 |
| 20 | 34 | $9,449 |
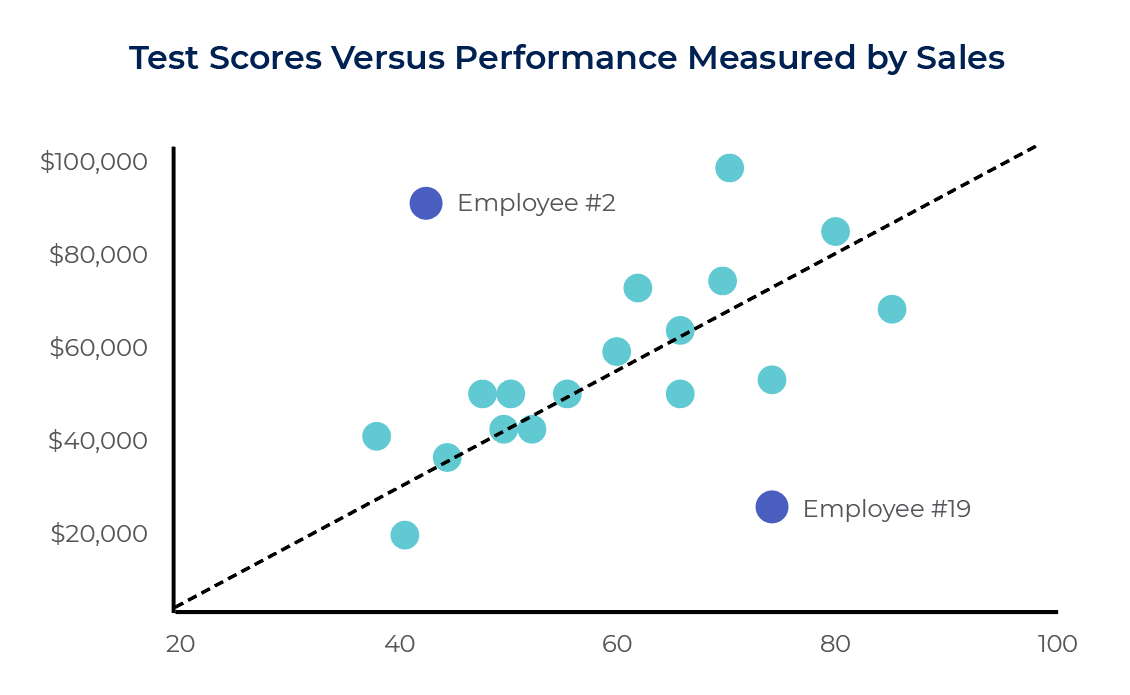
At a first glance, employee #2, the employee with the second highest monthly sales, scored rather poorly on the test. On the other end of the spectrum, employee #19, with the second lowest monthly sales, scored quite well on the test. These two employees, when examined individually, make it seem as if the test is not very predictive of job performance. However, when viewing the data sample as a whole on the scatter plot above, a clear and positive correlation is evident between test scores and job performance. In other words, as test scores rise, monthly sales rise as well. Employees #2 and #19 are both outliers because their data values exist outside of the general trend in the overall data sample. When determining whether or not a correlation exists, it is important to look at the overall trends in the entire data sample instead of focusing on a few outliers that seemingly contradict those trends.